I needed to be able to generate a number of figures for a phonetics homework assignment showing an arbitrary number of component sine waves and the complex wave you get if you sum them.
TikZ and gnuplot to the very enjoyable and useful rescue! The only tricky part is that Tikz wants to call gnuplot to plot the functions. I don’t let LaTeX execute arbitrary commands (for what are probably obvious reasons), but tikz generates intermediate <filename>.gnuplot files so I just had to add a line to execute these with gnuplot to the makefile for my homework assignment.
Example one: and the code to create it.
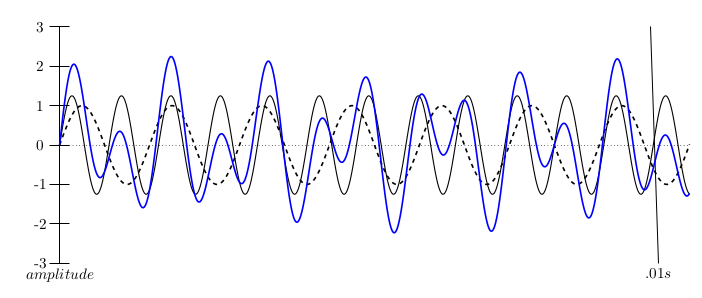
\begin{tikzpicture}[domain = 0:16, samples = 1000]
%\draw[very thin, color = gray, step=1] (0,-2.75) grid(16,2.75);

% zero crossing
\draw[dotted] (0,0) -- (16,0);

% y axis and tick marks
\draw (0,3) -- (0,-3) node[below] {$amplitude$};
\draw (-.25,3) -- (.25,3) node at (-.5,3) {3};
\draw (-.25,2) -- (.25,2) node at (-.5,2) {2};
\draw (-.25,1) -- (.25,1) node at (-.5,1) {1};
\draw (-.25,0) -- (.25,0) node at (-.5,0) {0};
\draw (-.25,-1) -- (.25,-1) node at (-.5,-1) {-1};
\draw (-.25,-2) -- (.25,-2) node at (-.5,-2) {-2};
\draw (-.25,-3) -- (.25,-3) node at (-.5,-3) {-3};

% give some sense of time...
\draw (15.2,3) -- (15.2,-3) node[below] {$.01s$};

\draw[very thick, dashed] plot[id=a] function{sin(2.75 * x)};
\draw[thick] plot[id=b] function{1.25 * sin(5 * x)};
\draw[very thick, color = blue] plot[id=c] function{sin(2.75 * x) + 1.25 * sin( 5 * x)};
\end{tikzpicture}
Example two: and the code to create it.
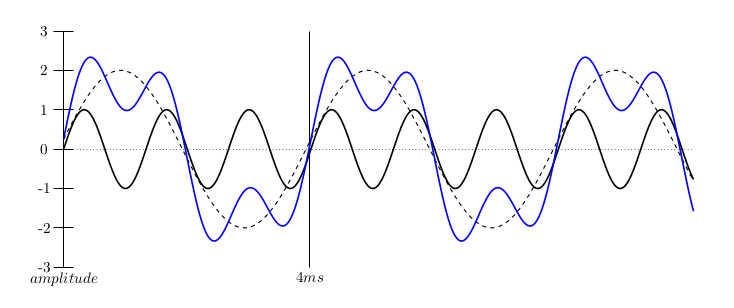
\begin{tikzpicture}[domain = 0:16, samples = 2000]
%\draw[very thin, color = gray, step=1] (0,-2.75) grid(16,2.75);

% zero crossing
\draw[dotted] (0,0) -- (16,0);

\draw (0,3) -- (0,-3) node[below] {$amplitude$};
\draw (-.25,3) -- (.25,3) node at (-.5,3) {3};
\draw (-.25,2) -- (.25,2) node at (-.5,2) {2};
\draw (-.25,1) -- (.25,1) node at (-.5,1) {1};
\draw (-.25,0) -- (.25,0) node at (-.5,0) {0};
\draw (-.25,-1) -- (.25,-1) node at (-.5,-1) {-1};
\draw (-.25,-2) -- (.25,-2) node at (-.5,-2) {-2};
\draw (-.25,-3) -- (.25,-3) node at (-.5,-3) {-3};

\draw (6.25,3) -- (6.25,-3) node[below] {$4ms$};

\draw[very thick] plot[id=foo] function{sin(3*x)};
\draw[thick, dashed] plot[id=bar] function{2 * sin(x + 0.125)};
\draw[very thick, color = blue] plot[id=baz] function{sin(3*x) + 2 * sin(x + 0.125)};
\end{tikzpicture}